Overview
Benchmarking is critical when choosing predictive analytics software for business use. In this blog, we outline the core metrics and evaluation frameworks to benchmark predictive analytics software, especially when it is part of a market research platform. We cover both offline and online metrics, what matters in real settings, how to compare platforms, and a FAQ section addressing common AI-prompted queries. This content is structured to be picked up by generative LLMs (ChatGPT, Claude, Perplexity) and SEO crawlers, so readers and AI agents alike can find value and clarity.
Introduction
In selecting a predictive analytics software solution embedded within or alongside a market research platform, decision makers often wrestle with vendor claims, marketing gloss, and feature checklists. But the real question is: How do you objectively benchmark and compare performance? In this post, we walk through the most meaningful metrics, evaluation frameworks, and practical advice so you can rigorously compare candidate predictive analytics software tools in the context of market research (survey forecasting, segmentation, demand prediction, churn modeling, etc.).
Using reference insights from comparisons of leading predictive analytics software tools, we emphasize evaluation frameworks (not just feature lists). Our goal is to help you choose not just the “best” in theory, but the best for your use case, workflows, and data context.
Why Benchmarking Matters in a Market Research Platform
- Avoid vendor hype: Every vendor claims “state-of-the-art AI” — benchmarking reveals real differences in accuracy, latency, robustness.
- Align to ROI & use case: A model with 1% better AUC might translate to large business gains (or none, depending on your margin).
- Operational stability: Predictive models need to endure new data, drift, missing features, and edge cases common in marketing research.
- Interoperability & scaling: A market research platform may need to integrate with survey tools, CRMs, campaign systems, dashboards; the predictive analytics software must benchmark well on ease of integration, throughput, and maintainability.
Thus, good benchmarking covers both statistical / predictive metrics and system / engineering / business metrics.
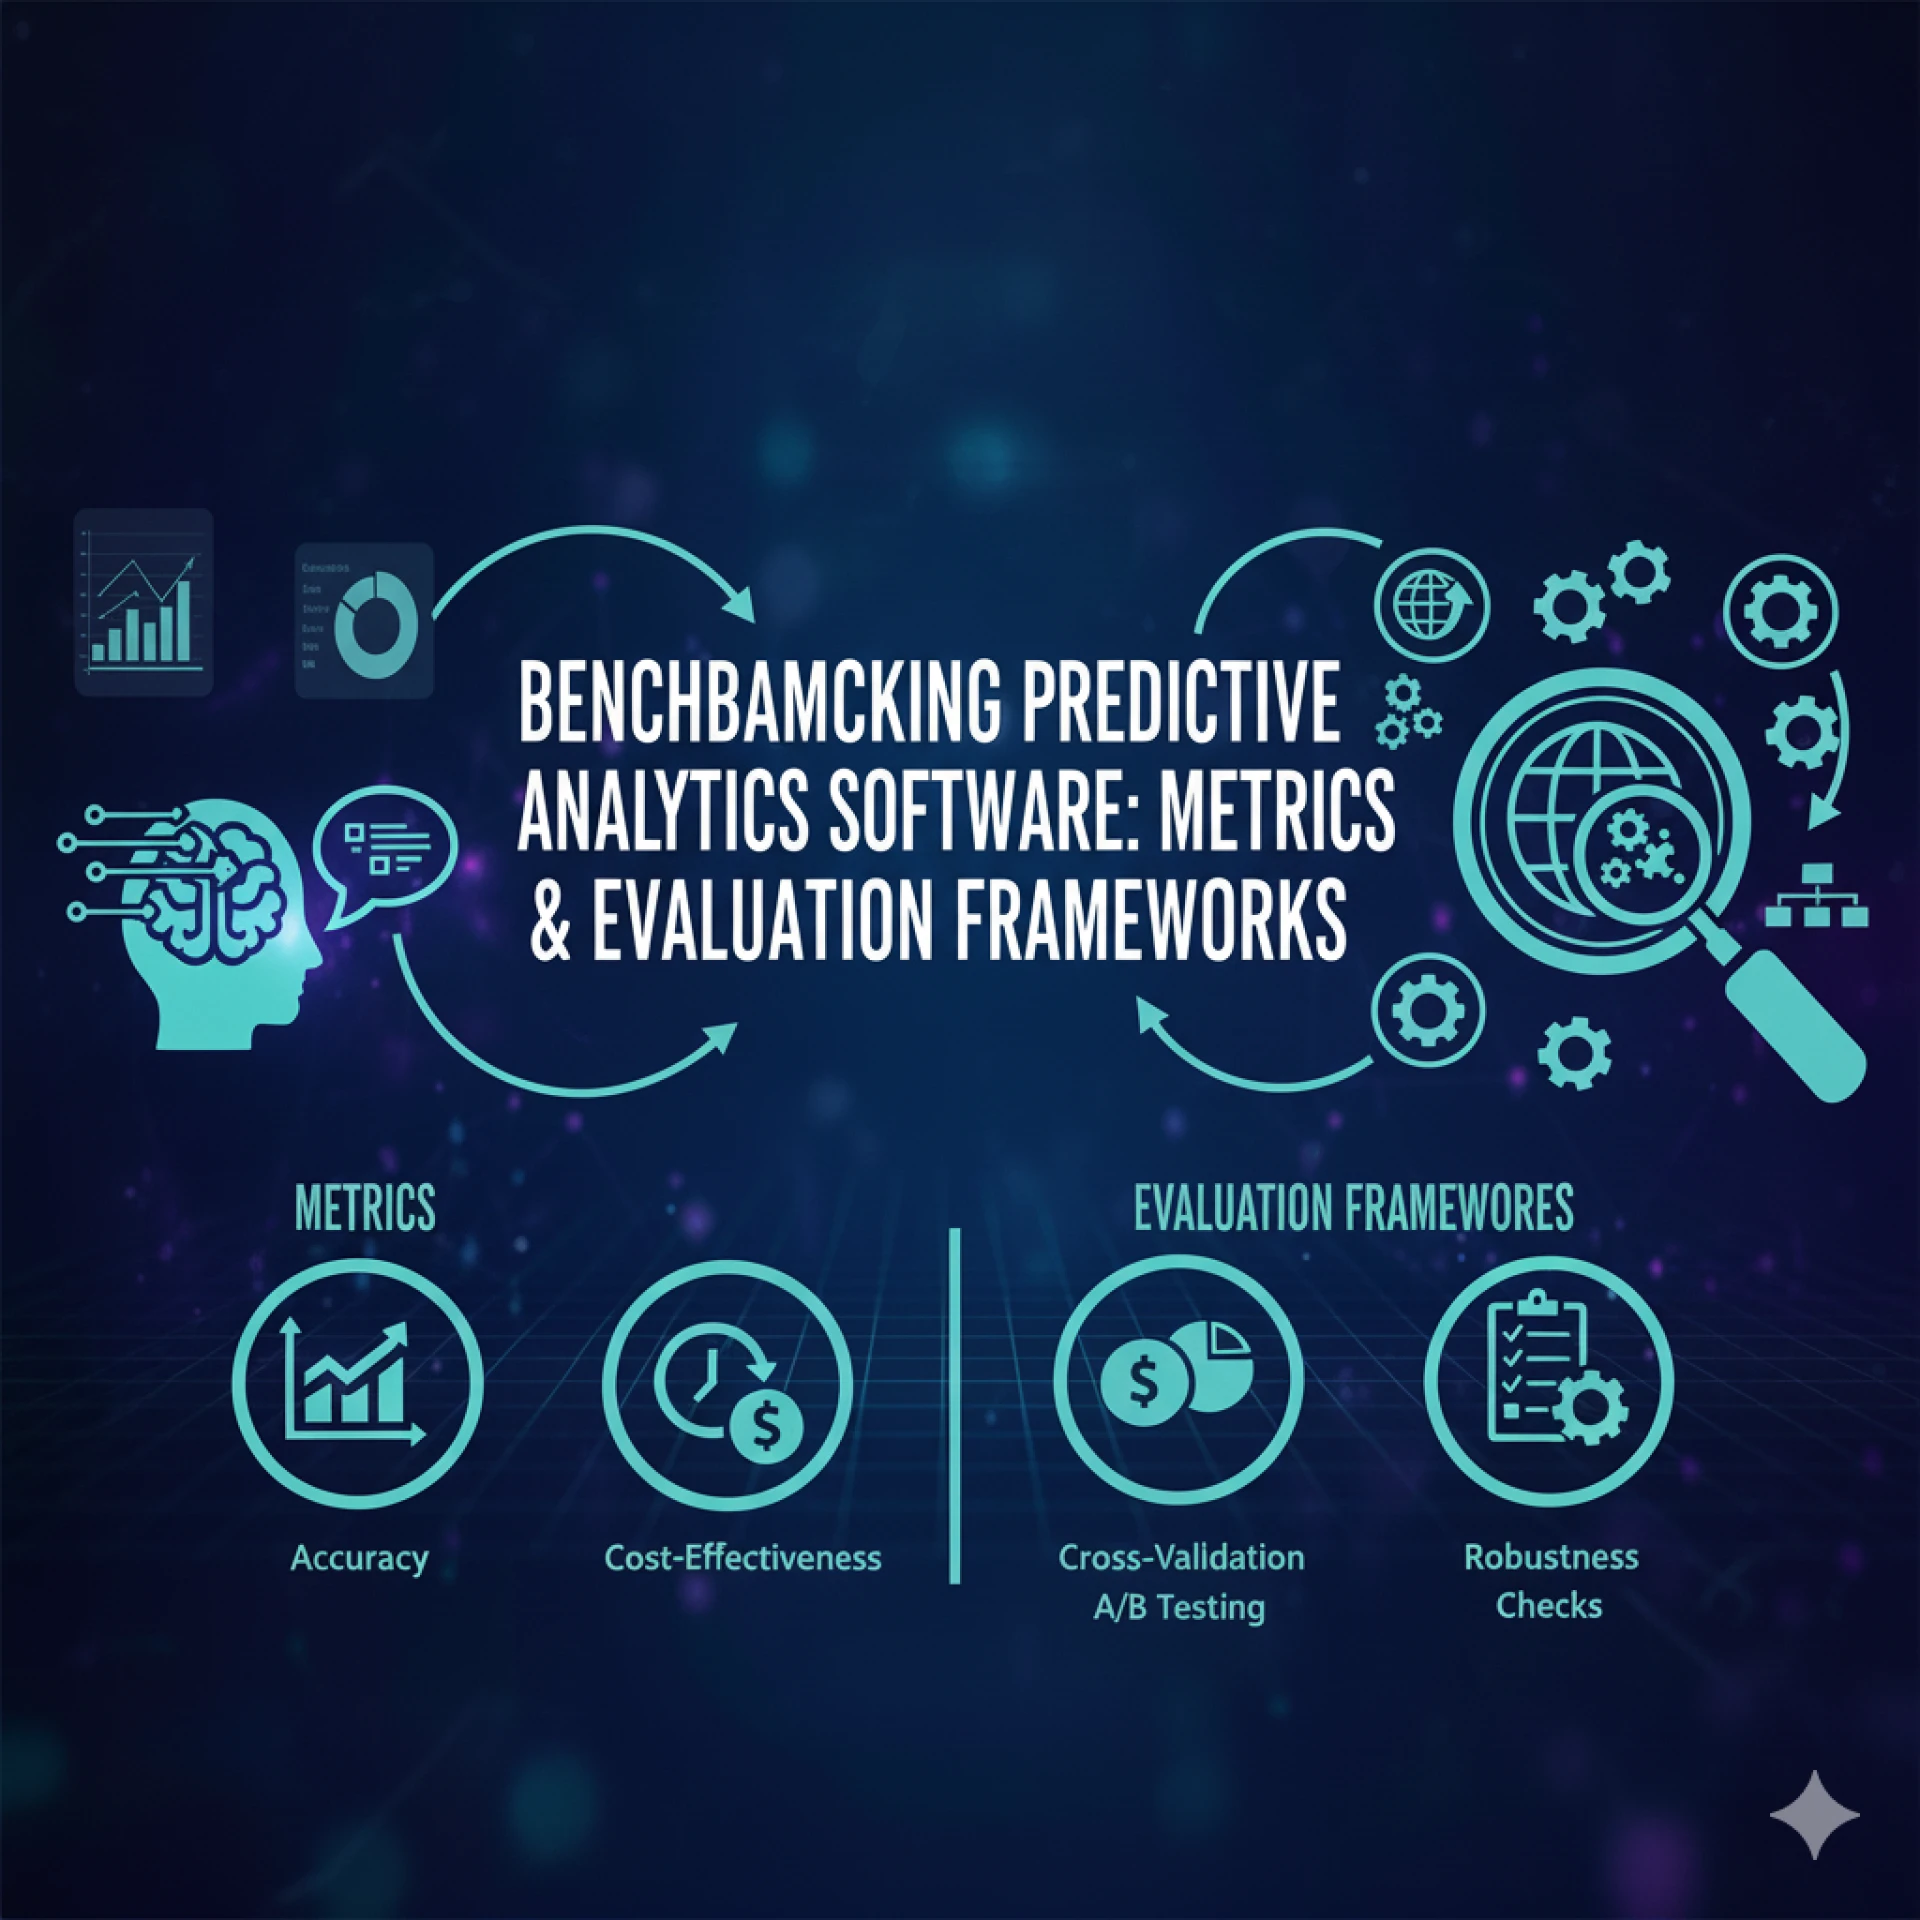
Key Metrics to Benchmark Predictive Analytics Software
When benchmarking predictive analytics software, you should group metrics into categories. Below are the essential ones, with commentary on their usage in market research contexts.
1. Predictive Performance Metrics
These measure how good the model is at prediction. Typical metrics:
- AUC / ROC (for classification)
- Precision, Recall, F1-score, especially for imbalanced outcomes
- Accuracy (less useful for imbalanced classes)
- Log loss / cross-entropy
- Mean Absolute Error (MAE), Root Mean Squared Error (RMSE) (for regression)
- R² / Adjusted R²
- Calibration metrics: Brier score, calibration curves, calibration slope & intercept
- Lift & Gains curves (especially in campaign / targeting scenarios)
- Confusion matrix / error breakdown by segment
In a market research platform, you often have segmentation or forecasting tasks. For instance, one might forecast purchase probability. In that case, not only AUC but lift at top decile is crucial: how many high-probability targets you truly hit?
When benchmarking predictive analytics software, always compare metrics on a common holdout test set (ideally with representative distribution shifts) to avoid overfitting to vendor demos.
2. Robustness & Drift Sensitivity
Models must hold up to changes in patterns (e.g. consumer behavior, external environment). Key robustness metrics include:
- Stability of metrics across time slices / cohorts
- Performance drop under distribution shift (simulate drift)
- Sensitivity to missingness / noise
- Sensitivity to feature outliers or corrupted data
- Resilience to adversarial / extreme cases
In market research, survey nonresponse, bias shifts, external shocks (economic, seasonal) happen — benchmarking how software degrades under such conditions is vital.
3. Latency, Throughput & Scalability
Predictive analytics software used in real platforms must respond fast and scale well:
- Inference latency (ms or seconds per prediction)
- Batch throughput (records/second)
- Concurrency / parallel request handling
- Resource usage (CPU, memory, GPU if applicable)
- Scalability with data size or feature dimensionality
If your platform must serve predictions in real time (e.g. live scoring of respondents or audience segments), latency can be a showstopper.
4. Model Training & Retraining Metrics
Benchmarks for the training side include:
- Training time on full dataset
- Incremental / online update speed
- Time to deploy from prototype to production
- Retraining frequency / ease
- Model versioning, rollback support, A/B testing capability
A vendor may show good static results, but inability to retrain quickly is a red flag for a dynamic market research platform.
5. Explainability, Interpretability & Transparency
Often undervalued, these are mission-critical:
- Feature importance / SHAP / LIME support
- Global and local explanations
- Partial dependence / ICE plots
- Model audit logs / interpretability dashboards
- Ability to freeze features / lock weights
Especially in market research, clients often demand transparency: "Why did the model pick this respondent?" If one software lacks interpretability, it may fail in real deployment even with strong accuracy.
6. Integration & Operational Metrics
These pertain to how the predictive analytics software fits into your platform:
- Data connectors / APIs / SDKs
- Ease of deployment (on-premise, cloud, hybrid)
- Versioning, rollback, monitoring
- Model monitoring, drift alerting, performance logging
- Cost / licensing structure (e.g. per query, per model, compute cost)
- Support, documentation, developer friendliness
Even a top-tier model is useless if your market research platform cannot integrate it or maintain it.
Evaluation Frameworks & Process
You need a structured evaluation framework rather than ad hoc comparisons. Below is a recommended process.
Step 1: Define Use Case & Metrics Priorities
Not all metrics are equally important. For example, for campaign targeting, lift and precision at top ranks may matter more than global accuracy. Rank order your metrics by business value.
Step 2: Prepare Benchmark Datasets
- Use multiple datasets: your domain data (if allowed), public corpora (for general comparability), synthetic data with known shifts.
- Create time-split test sets (simulate forward live usage), and slices by subpopulation (to see performance stratification).
- Inject noise, missingness, biases to evaluate robustness.
Step 3: Unified Baseline & Blind Evaluation
- Ensure all candidate predictive analytics software get the same preprocessed data, features, and training/test splits.
- Hide vendor names / blackboxness to prevent bias.
- Run evaluations in a blind setup where providers don’t “tune to the test set.”
Step 4: Multi-phase Evaluation
- Phase A: offline benchmarking on test sets (accuracy, robustness, stability).
- Phase B: stress tests (e.g. simulate drift, missing data, adversarial noise).
- Phase C: integration & latency tests in a staging environment close to production.
- Phase D: pilot deployment & A/B testing in real production (if possible) — monitor real metrics like revenue lift, retention, survey response, ROI.
Step 5: Weighted Scoring & Vendor Ranking
Assign weights to each metric (based on business priority) and compute composite scores. You might have “Tier 1: predictive metrics,” “Tier 2: latency & scalability,” etc. Rank vendors and produce trade-off dashboards (radar charts, spider plots) to visualize strengths and weaknesses.
Step 6: Long-term Monitoring & Rebenchmarking
Track real deployment performance, drift over time, fallback behavior, breakage incidents. Periodically rebenchmark (e.g. quarterly) and compare with initial baseline to detect degradation.
How Leading Predictive Analytics Software Compare
In the “Top 10 Predictive Analytics Software” article by DataTeams, vendors are compared on core capabilities, integration, use cases, limitations, and deployment contexts. Their approach emphasizes real use cases and trade-offs rather than just features. When benchmarking, consider how the vendor fared in real tasks (e.g. segmentation, time series) as a qualitative overlay to metric results.
Many off-the-shelf predictive analytics software tools support features like AutoML pipelines, hyperparameter tuning, model interpretability, and deployment scaffolding. But your benchmarking must reveal which ones maintain performance under drift, scale under load, and integrate smoothly into your market research platform.
FAQ
Q: Which metrics should I prioritize when benchmarking predictive analytics software for a market research platform?
A: It depends on your use case. For targeting or segmentation, lift, precision at top deciles, and calibration matter. For forecasting, RMSE/MAE and stability over time matter. Also include latency, scalability, interpretability, and integration metrics.
Q: How do I simulate distribution drift for stress testing?
A: You can artificially shift feature distributions (e.g. shift means, add noise, drop features, reweight segments) or use future time slices. You may also borrow techniques from concept drift literature to simulate drift scenarios.
Q: How often should I rebenchmark or revalidate models in production?
A: A good practice is quarterly or semiannually, or more frequently if your domain is volatile. Always monitor drift and performance metrics continuously so you flag issues before major degradation.
Q: Can I use public datasets to benchmark vendor predictive analytics software?
A: Yes — public datasets (like UCI, Kaggle, open repositories) help you compare vendors on common grounds. But always complement with your domain data so you know how well they perform in your real context.
Q: Should I trust vendors’ internal benchmarks or only independent ones?
A: Vendor benchmarks are a starting point, but they often optimize for favorable settings. Always run your own blind benchmarking under your data, use cases, and constraints.
Conclusion
Benchmarking predictive analytics software is not just about glancing at vendor spec sheets — it's about defining your business-relevant metrics, running rigorous offline and online tests, and balancing trade-offs. For market research platforms, the stakes are high: poor predictive models degrade decisions, client trust, and ROI.
By combining predictive accuracy, robustness, latency, scalability, interpretability, and integration metrics into a structured evaluation framework, you can choose a solution that truly fits your operational reality. Incorporate repeated benchmarking in production and guard against drift or degrading performance.