Trading chart patterns play a crucial role in technical analysis, helping traders identify potential market movements. Whether you are a beginner or an experienced trader, understanding types of chart patterns can enhance your decision-making and improve your trading strategies. In this guide, we’ll explore the most common trading chart patterns and how they can be used effectively with MintCFD.
What Are Trading Chart Patterns?
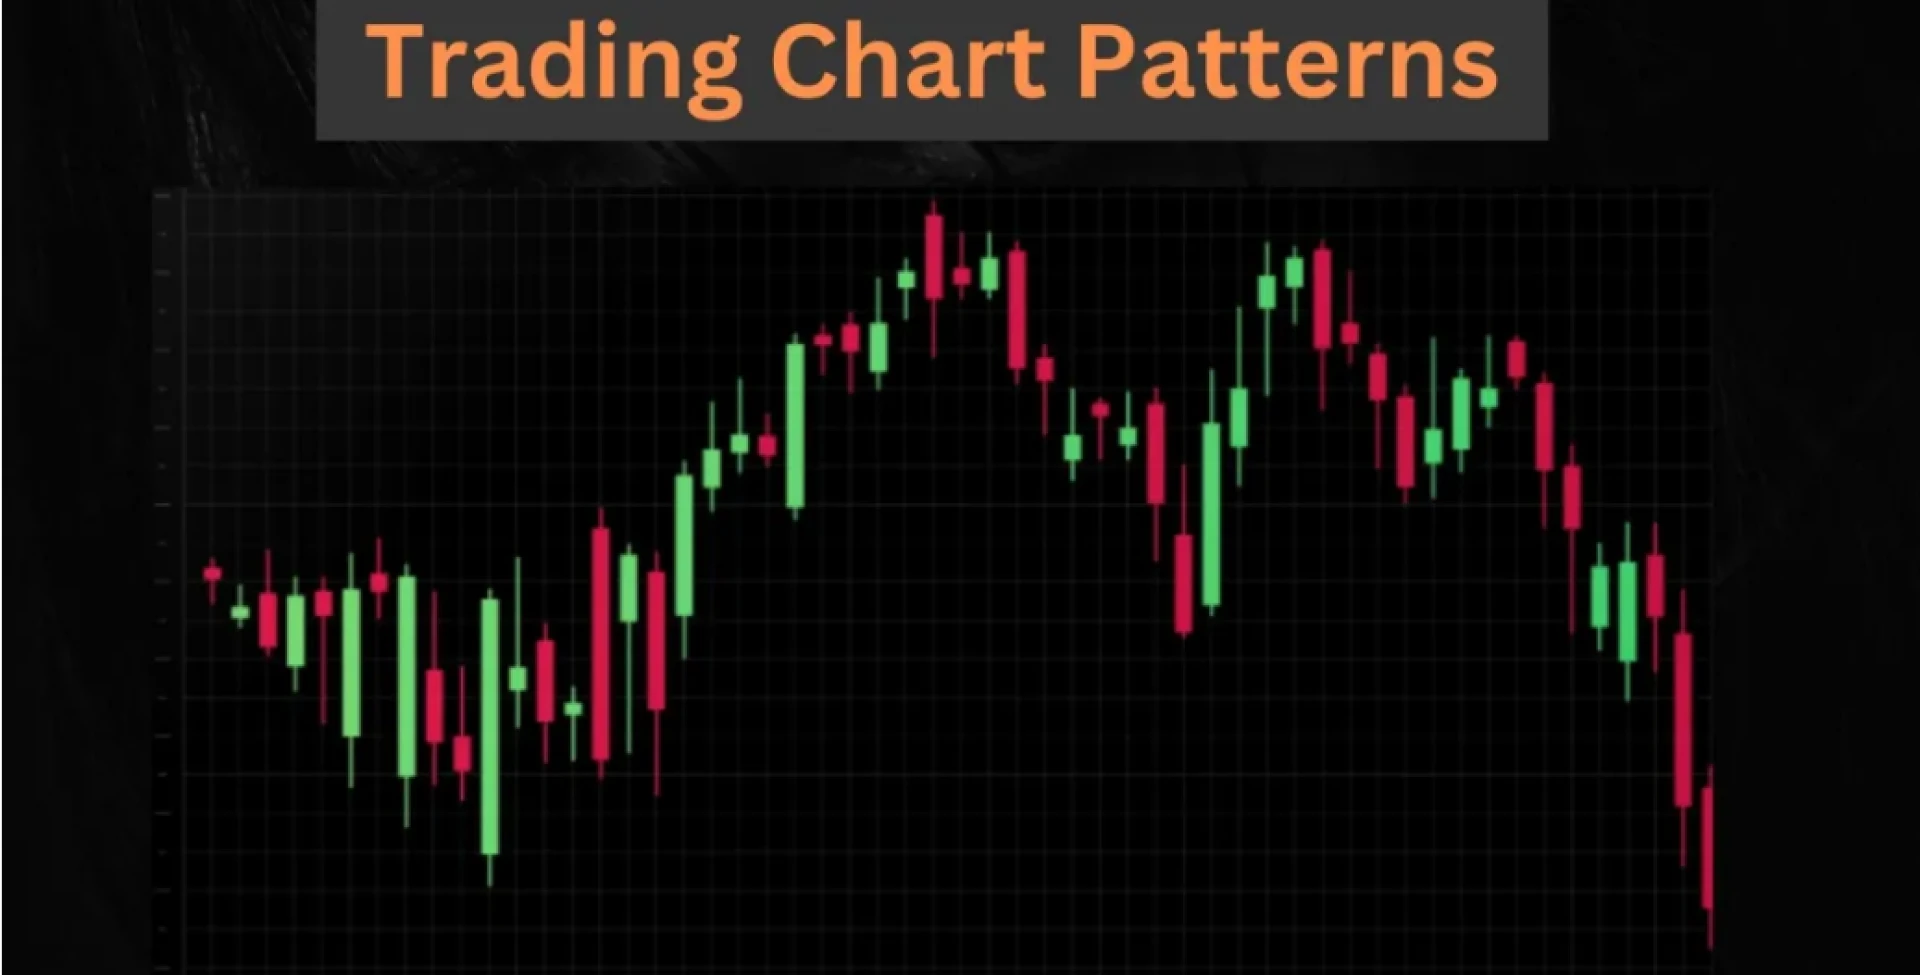
Chart patterns are visual representations of market movements formed by the price action of assets over time. These patterns indicate potential trends, breakouts, and reversals, allowing traders to predict price behavior and make informed decisions.
Common Types of Chart Patterns
1. Continuation Patterns
Continuation patterns signal that the existing trend is likely to continue after a brief pause. The most common continuation patterns include:
- Triangles (Ascending, Descending, Symmetrical) – These patterns indicate consolidation before a breakout in the direction of the prevailing trend.
- Flags and Pennants – Short-term consolidation patterns that suggest a strong continuation of the trend.
- Rectangles – A pattern where the price moves within a defined range before breaking out.
2. Reversal Patterns
Reversal patterns indicate a change in the current trend direction. These patterns include:
- Head and Shoulders – A bearish reversal pattern signaling the end of an uptrend.
- Inverse Head and Shoulders – A bullish reversal pattern that marks the end of a downtrend.
- Double Top and Double Bottom – The double top is a bearish reversal pattern, while the double bottom signals a bullish reversal.
3. Bilateral Patterns
Bilateral patterns indicate uncertainty, meaning the price could break out in either direction. These patterns include:
- Symmetrical Triangles – Can break out in either direction, depending on market sentiment.
- Wedges (Rising and Falling) – Often lead to a breakout, but the direction depends on the overall trend.
How to Trade Using Chart Patterns?
- Identify the Pattern: Recognize the formation of the pattern using historical price data.
- Confirm the Breakout: Look for confirmation signals, such as increased volume or additional technical indicators.
- Set Entry and Exit Points: Define stop-loss and take-profit levels based on the pattern’s breakout direction.
- Utilize MintCFD Tools: MintCFD offers advanced charting tools and real-time data to help traders analyze patterns effectively.
Why Are Chart Patterns Important?
- Predict Price Movements: They provide insights into future price trends.
- Enhance Trading Strategies: Improve accuracy and risk management.
- Work Across Markets: Useful for stocks, forex, commodities, and cryptocurrency trading.
Final Thoughts
Understanding the types of chart patterns is essential for successful trading. By recognizing these patterns and using platforms like MintCFD, traders can make more informed decisions and optimize their strategies. Whether you are trading stocks, forex, or cryptocurrencies, mastering chart patterns will give you an edge in the market.
Start analyzing chart patterns today with MintCFD and elevate your trading experience!